A few weeks ago, gold and
silver bugs were cheering at the silver COT report, which was showing large
specs going net short silver for the first time in over 3 years. The narrative went like this: “Last time this
happened in May 2019 at $15/oz, Silver doubled in 15 months.” There is nothing
false about that statement. The last time this happened was indeed in 2019 at
15/oz, and silver did double from there 15 months later hitting $30/oz in Aug
2020. The question isn’t if the statement is false, its “is this relevant to
where we are today?”
Let me back up, as I am
sure there are some people who either have no idea what COT reports are telling
you or why they’re relevant, or worse, they’ve been sold on the incorrect
narrative gold perma-bulls have been shouting for literally decades, about how “J.P.
Morgan/Deutsche Bank/Bank of America etc, silver shorts about to be squeezed
any minute now” and how that will send silver prices to the moon. (Spoiler, it’s
never happened, and it never will.)
COT reports, or the
Commitments of Traders, is a report that comes out every Fri afternoon that shows
the position sizes of 3 major “groups” of traders: large specs, small specs and
commercials. Large speculators are essentially hedge funds. As a group, they are momentum chasers, meaning
they have a tendency to add to long positions as price is moving strongly
higher until their net longs are at very high levels at the market peak, and
inversely, sell their positions as a market goes down until they, as a group,
have very little longs or are even net short at market bottoms. For this
reason, they are often given the nickname “the dumb money”. Small specs are
retail traders. They are basically you and me (but with deeper pockets). Their
positions in a market are typically not very significant and rarely important
in terms of analyzing the COT report, so for the most part we are going to
ignore them.
That brings us to the
commercials. Commercials are the banks. Their positions have a tendency to be exactly
inverse to the large specs, as well as price. As a market moves higher, they
typically are increasing their short positions and as a market moves lower,
they begin to decrease them or even go net long into major lows. This chart
below of Soybeans over the last 5 yrs is a perfect example of what I mean. The
large specs (green line) were net short soybeans from the end of 2018 until the
end of 2019, when price was ranging between 800-1000, while commercials (red
line) were net long 145k contracts in May 2019 at 800. 1 year later, price had doubled,
and large specs chased it all the way up, going from net short 123k contracts
at 800, to net long 250k contracts at 1600. The commercials on the other hand,
were massively net short at the top.

Now here is where the misinformation
in the gold and silver sector come from. All the talk of commercials (banks) being
massively net short as price is moving higher, and a short squeeze that will
send prices skyrocketing any minute now, is a fundamentally incorrect analysis on
how the market operates. There is a very simple reason why we have never seen this
“J.P. Morgan silver position short squeeze” and why we never will. Because the commercials
are not taking a position in the market betting on price direction either way.
The commercials are
essentially opportunistic merchants. If people want to buy, they want to be
there to sell it to them and vice versa. They are not racking up a massive
short position in silver because they are betting on lower silver prices, they’re
short position is simply the other side of the large specs who are eager to
buy. They profit from the transaction. That
is it. Banks don’t make “bets,” they invest in “sure things.” What you don’t see
regarding their “massive silver short positions,” is derivative holdings that zero
out all exposure to the market in any direction. If prices skyrocket, they
profit and lose nothing. If prices collapse, they profit and lose nothing.
Wall Street is the most
competitive industry in the world. The most intelligent minds on earth don’t
work for NASA, they work for Goldman and Citigroup. These are organizations
that have trillions in assets and the smartest people in the world managing
them, with a goal to take as little risk with them as humanly possible and
still profit. Why on earth would an entity like J.P. Morgan, be stupid enough
to leave themselves open to blowing up their entire firm over a bad directional
bet on silver? Of course those short positions are hedged! Sure, it’s not
impossible that someone could leave themselves open to such a risk (Lehman Brothers),
but it is not very probable and is simply not how they operate in the futures
markets, or how commercial COT positions are supposed to be interpreted.
So, the next time you see
a self-proclaimed “gold and silver expert” and “professional” in the market
talk about commercials or a major bank about to be “squeezed” due to their
silver or gold short positions, promptly disregard EVERYTHING they are saying.
They are either ignorant of how the market works and therefore no expert or
professional in any capacity, (in which case you shouldn’t pay attention to
what they have to say), or they DO know better and are trying to profit in someway
off of the “doom” narrative of a collapse of a major banking firm and a precious
metals “moonshot” (in which case you shouldn’t pay attention to what they have
to say.)
Ok, so where is the
problem here? If large specs, or “dumb money” always chase price higher and
lower and are always heavily on the wrong side at the wrong time, how is this
not spelling out a major low for silver and possibly gold as well? It’s simple.
Because as a rule of thumb, large specs don’t sell bull markets.
Yes, the last time large
specs went net short silver was the last dip in 2019 down near the lows,
anticipating either a retest of 14, the low from both 2015 and 2018, or a break
below it. They were wrong and were forced to cover and chase price higher as it
doubled over the next 2 years. But is that an accurate comparison to where we
are now?
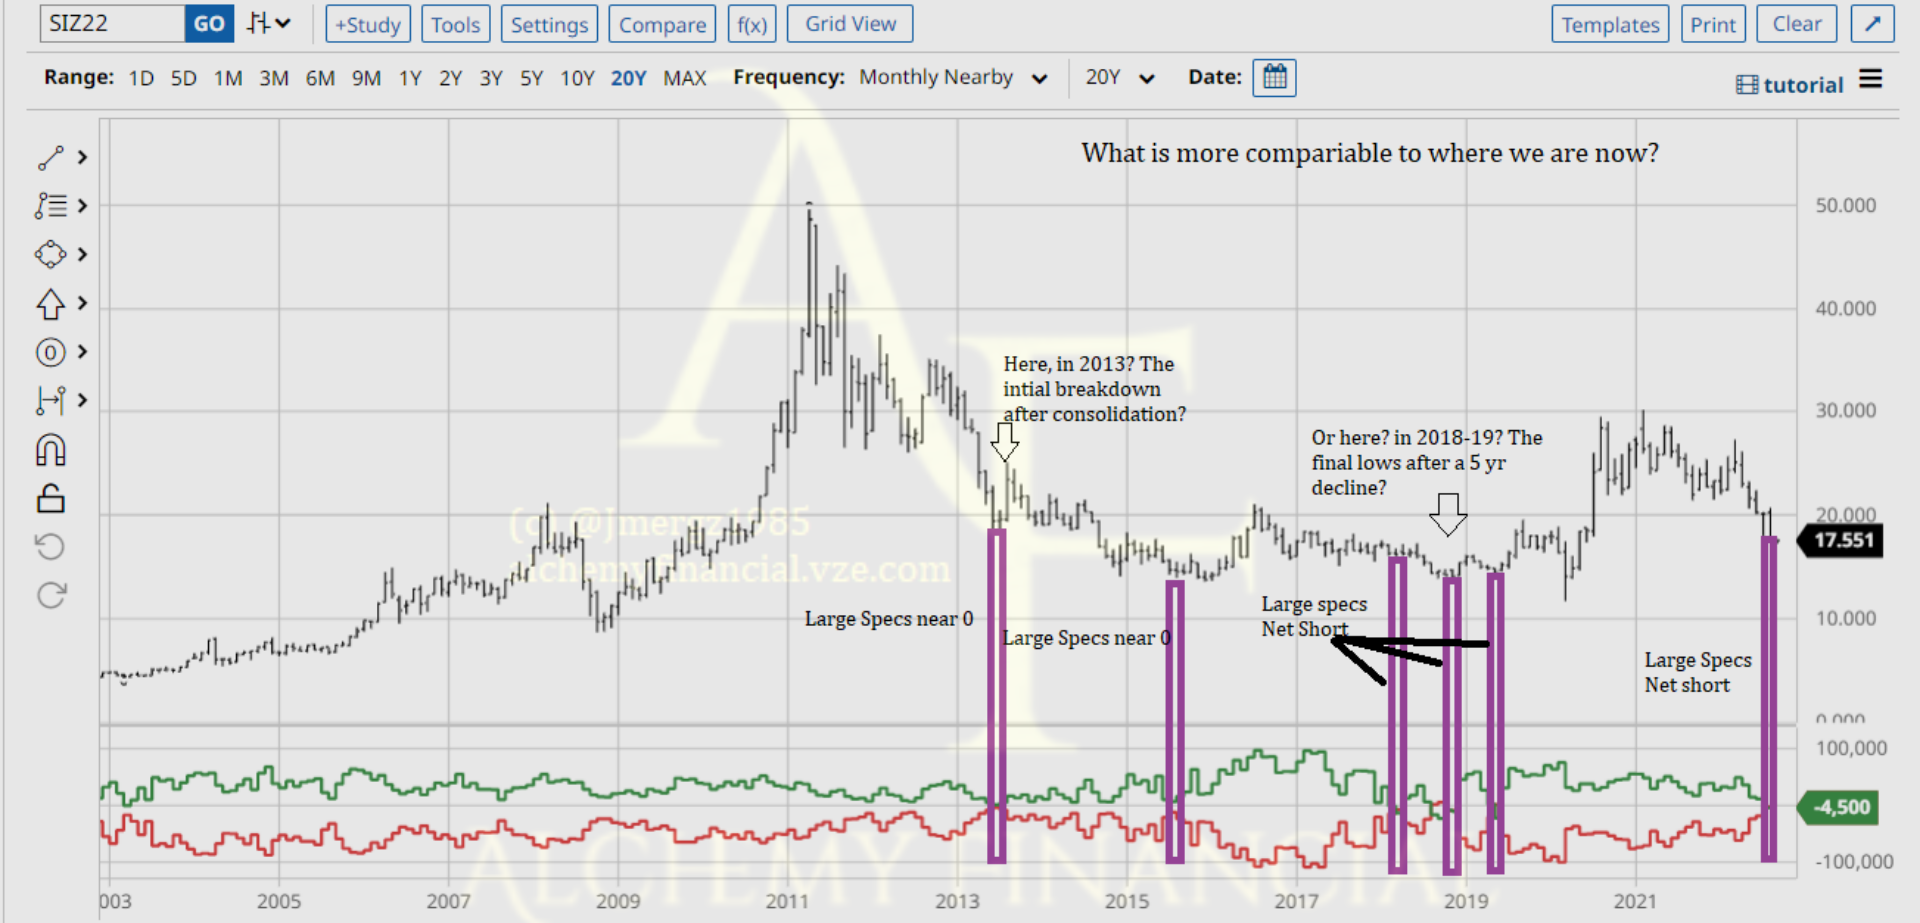
From 2009 to 2011, silver
went from a low of $8, to a high of $50. 2 years of higher highs and higher
lows, exactly what an uptrend or a bull market is. From 2011 to 2013, silver
corrected from that parabolic high and consolidated between 25 and 35. In 2013,
silver began breaking down, making lower lows and lower highs and this
continued for 2 years until 2015, bottoming at $14/oz. From 2016 to 2018 silver
spent 2 years going sideways, retesting its lows as it consolidated at a major
bottom. Then, from 2018 to 2020, it spent 2 years going higher again, and from
2020 to 2022, another 2 years consolidating.
From 2009-2011 as silver
made higher highs and higher lows, large specs NEVER went net short silver.
From 2011 to 2013 as silver consolidated going sideways from 25-35, large specs
NEVER went net short silver. In fact, for the total of those 4 years, the
position size of the large specs never fell below 6k contracts net long. The first
time large specs positions dropped below that (and were nearly net short) was
in June 2013, as silver began making lower lows. Their position size dropped to
837 contracts, down from 41k contracts 7 months earlier.
Over the next 6 years, as
silver continued lower, their long position sizes decreased significantly
versus the previous years when silver was moving higher and consolidating after
a big rise. In March 2018, they were net short 13k contracts at ~16.50 an oz.
In November 2018 they were net short again by 11k contracts. In May 2019 they
went net short a 3rd and final time at $14.50/oz. That is a total of
3 times they went net short during the consolidation at lows in a bear market,
and one time where they were nearly net short as silver began its decline in
2013, breaking down from its consolidation and beginning a trend of lower lows and
lower highs.
Today, we have a silver
market that was moving higher from the lows in fall 2018 to the highs in Aug 2020.
In one instance in May 2019, they were net short. They quickly flipped that
wrong position and 2 months later, they were net long 64k contracts. From
2020-2022 as silver was consolidating between 20-30/oz, they were NEVER net
short silver. Now, as silver has started to decline, making lower lows and
lower highs, surprise, surprise, large specs have gone net short again.
So, you tell me, does where
we are today sound like the final low after a long, brutal decline in price over
a period of 2 years, and a long basing consolidation at those lows for another 3
years? Or does it sound more like that initial drop in long positions that
large specs had in silver in 2013, that was almost net short as price BEGAN making lower lows and lower highs?
Yes, large specs going
net short a few weeks ago is likely piled too far on the bearish side and A low
is likely to occur, as it has in the past when they’ve gone net short or
reduced their long positions significantly. In fact, that is exactly what
happened, and I pointed out that I expected we were making A low in silver on
July 13th, and that we could rally up to 21, but this low was not a
good idea to go long on and a better opportunity would be shorting the rally
after it occurs. Silver bottomed the next day on July 14th and 1
month later hit $20.85. That was just 2 weeks ago and we are now at 17.40, a
17% loss and a new low.
But much like in 2013, it
was just A low, not THE low. I know many are interpreting this as the end of
this decline being near, but I see it exactly opposite.
This isn’t the bottom or
the end of the decline, it’s confirmation that we are indeed in a bear market,
and likely still the early stages of it.
I know that’s not what
people want to hear, but that is the reality, and I’ve been warning of this
risk for 15 months, since June 2021. I said miner’s underperforming is a big
warning sign, like it was in 2013 and it has been again. GDX has lost 36% and
GDXJ has lost 42% since then. I said miner’s lead the metals and they are
leading them lower today like they were in 2013 and they have continuously made
lower lows, just like they did then. GDX, GDXJ, SIL & SILJ all broke to new
lows long before silver followed. Gold has yet to break 1680, but I think that
time is very near. I said sentiment will get very bearish and stay there for
long periods like it did from 2013-2015 and it has again. I’ve pointed out COT
positions in bear markets can drop much lower like they did from 2013-2015 and
they have again as well. I’ve said price can get very oversold and stay there
for long periods like it did from 2013-2015 and we have also seen that repeat
again. All while perma-bulls accused me of “selling at the low,” shouting the
most dangerous words in investing in response to my analysis: “It’s different
this time.”
Ladies and gentlemen,
there is nothing new under the sun. History doesn’t always repeat verbatim, but
it does rhyme, and this time has rhymed near perfectly with 2013. The macro
doesn’t matter. PE ratios don’t matter. Fundamentals don’t matter. The only
thing that matters, is the human emotions of greed and fear. That is what makes
up day to day price action, and that is why we can see so many similarities in
price action in the gold and silver sector today, with what happened in 2013.
Ironically, many of the
same people shouting “it’s different this time” are the ones who have shared
comparison charts of the S&P-500 today versus in 2008. Was the macro not different
then? Even the S&P components were different then! But human emotion is not,
and we can see that play out in nearly identical price action. The Macro in the
1600s in The Netherlands was very different from the United States in the 1990s.
The fundamentals of tech stocks and tulip bulbs were different as well. Yet,
the chart of price action in both is identical, because price action is not dictated
by fundamentals or macro-economics. It’s greed and fear. That’s it.
Before I wrap this up, I
wanted to mention a few more things regarding the environment in the precious
metals sector versus 2013. It continues
to be remarkable to me how similar the things people are saying and doing today
versus back then. It truly is identical, and people don’t even seem to notice
they are doing it. For those who didn’t live and trade through it, I will give
you some examples of what I saw happening then. You decide how similar it is to
today, and whether that is as worthy of serious concern as I have thought (and
continue to think) it is.
First, everybody was in disbelief
that it was happening. When the Fed hinted at taper in 2013, the gold
perma-bulls crowed that they could never do it, that the entire economy and
financial system would collapse if they even decreased their printing by even
just a little. When they did, they said “they’ll reverse and start increasing
their printing again within a month or 2”.
Then it was that they could never raise rates, for the same reasons, an
immediate collapse. When they did, they said, “one and done” and that they’ll
be cutting again (from 0.25%, lol) in months. They screamed about the national
debt, and how rates at just 2% would increase our interest payments on the debt
by “X” amount, and the Fed would never allow that to happen. (That was 15
trillion dollars ago). Everyone was waiting for the “pivot” that would
certainly send gold much higher when it came. It wouldn’t come for another 4
years, and when it finally did, gold had already rallied 25% from the 2018 low,
so the idea of buying gold when the fed pivots, was a misguided plan of action
to begin with.
People were talking about
poor sentiment that continued to get worse, sharing charts like the Gold miner’s
bullish precent index at levels below 10, which MUST mean we are at a bottom. It
stayed below 10 for 6 months in 2013. (Today, the gold miners bullish precent
index has been below 15 for 2 straight months). Many were talking about how miners
were trading at the same levels that they were when gold was 1300, but yet it
was north of 1550. They thought that in the most competitive industry in the
world, there was a free lunch being left on the table for any idiot who can
look at a chart and see a discrepancy between miners and the metal to gobble
up. Easy money buying miners here, right? Miners didn’t revert back to pricing
gold at north of 1550 and have huge gains, instead gold fell to 1300. I’ve seen
a lot of people saying in the last few days, that GDX and GDXJ are trading like
gold is back at 1400. That does not mean an easy money opportunity, just as it
wasn’t then. It’s a warning that gold is likely going to fall to 1400.
People were already on the edge. By the time gold was ABOUT to break support at 1550, GDX had already lost 50% from its 2011 peak. (Currently, at 23, GDX has lost 50% from it’s 2020 peak of 46, and again, gold has not broken it’s support at 1680, yet.) If history repeats from this point, we have a dark future ahead for us. Many are already on edge again today but are holding on because they know it is foolish to sell when miners are already down 50%. They’re about to witness the worst losses in a single day that their portfolio has ever suffered. When gold broke support at 1550, it was a total of $500 down to get to our final low at 1050 2 years later. Half of that $500 in losses came in just 2 back-to-back days once support broke. Major silver producers were down 20% in 1 day. Major gold producers were down more than 10%. Jr’s got obliterated. Many suffered such extreme losses, (and later forced dilution at extremely low prices) that it rendered it nearly impossible for most investors to get back to even, let alone to ever see a profit on those investments.
We
did see a bottom about 1 month after that and a decent rally following, but
then it was back to making lower lows in what ended up being a market that
started as a bullet to the chest, and ended with “death by 1000 paper cuts” 2
years later, for an ADDITIONAL loss of nearly 50% from those break down lows on
GDX (From 67 in 2011, to 35 in 2013 BEFORE gold broke support, to 22 in 2013 AFTER
gold broke down, then to 12 in 2015 when it finally bottomed).
Being that miners had
already been so weak before the breakdown in gold, everybody thought it must be
a flush out, capitulation bottom. It wasn’t. They’ll say the same again when
gold breaks 1680. It won’t be capitulation this time, same as it wasn’t last
time. It won’t truly be capitulation until most of these talking head,
perma-bulls in gold just disappear entirely. When NOBODY wants to talk about gold at all. (Here’s an example. A PM analyst I
knew in 2015 left his job to go become a dentist, because the sector was that
bad. THAT is what you see at capitulation lows, not moderate depression amongst
an ever-stubborn group of perma-bulls. What we need is epic and total despair,
and we unfortunately are not there yet.)
The break is coming, and
very soon, I fear. Time is up. With a long weekend ahead of us, I wouldn’t be
surprised to see gold open next week down $50-100. And then do it again the following
day. No, I am not kidding or exaggerating. I think we breakdown hard and very
soon. I’ve done all I can to warn as many people as possible for the last 15
months, to try and help people from making the same mistakes I saw so many make
back then that bankrupted them. If you haven’t taken any actions to protect
yourself, you are now at the mercy of the market. The only thing left to say
is, “Good Luck.”
-Jonathan M Mergott
