Life is funny. Last year in March, gold ~1680 and I had called for a bottom. We did bottom and had a nice rally back up to 1920 by May. The move was a little steep, but I thought after a pullback, we 'd be set up nicely for a move into the 2400 region, possibly by Aug, which is the month gold makes peaks in far more than any other month. By June, after the FOMC with the Fed dropping the “taper” bomb onto markets, things took a very different turn and it was clear that 2400 target for Aug was off the table. In fact, the whole bull market was possibly “off the table” and the reaction of metals and miners afterwards turned me very bearish, as I began having flashbacks of the 2013-2015 decline.
We declined significantly
all summer and fall, and when we didn’t break down after 6 months, I got
bullish again in Jan, pointing out that consolidations in gold typically break
out after 18 months, and Feb would be month 18. Sure enough, we began rallying
strongly in Feb and by March we were retesting all time highs. 2 days after the
peak, I pointed out DSI numbers on gold and silver at 95 and 93, so a top was
probably in for now, but after a month or so of pulling back and shaking out
some late coming bulls, we’d be setting up a nice cup and handle from a TA
standpoint with a target of ~2400 that could be achieved again, in golds
favorite month to make highs, Aug.
Here we are again in June
with a very different picture, and I will now refrain from ever calling for
2400 gold by Aug ever again. (But just know, that if it happens, I was thinking
it). It seemed like we were ready to go, that the gold bugs had been vindicated
after watching gold go nowhere in the face of the highest inflation since the
70s. But alas, it was not to be. We had every tail wind we could ask for. We
got a retest of highs, then a collapse. That is a bad sign, and very
reminiscent of gold’s final rally to 1800 in 2013 before collapsing down 40%
over the next 2 years.
On the one hand, I’m glad
I turned bullish when I did, because it was a huge move in miners from Feb to
April that was definitely worth catching. In hindsight, I had written in April
about the idea of this being a “false break before the real move” and dismissed
it as unlikely to me, due to the extremeness of the “false move” swing higher.
A 45% move higher in GDX over just 3 months that then unwinds, losses all of
its gains, and then breaks to new lows seemed like a less probable scenario.
But that is exactly what happened. I wish I had given this more credibility at
the time, perhaps I could have rung some warning bells sooner.
But what’s done is done.
What matters now is, “where do we go from here?”
I’ve seen a lot of charts
and metrics thrown around recently. Things like, “Zero miners in the GDX
currently above 200 day moving average”, “Gold miners Bullish precent index at 2-year
lows”, “COT reports showing lowest large spec long positions in gold in 2
years”, and anyone reading the room of gold stock investors, knows that
sentiment is in the toilet right now.
“Buy when there is blood
in the streets.” So, easy answer, right? Not necessarily. All of these factors would make gold, silver
and miners a screaming buy right now IF, and ONLY if, we are in a bull market.
I know there are many
gold bugs out there looking around at the state of the world we live in and
thinking that we are absolutely, beyond a shadow of a doubt, in a bull market. I
know plenty who said the same thing in 2013, and thought they were getting a
free lunch buying gold stocks at 30% discounts from where they were 1 year
earlier when the price of gold had been unchanged since then. But there is no
free lunch on Wall Street. The “discount” they thought they were getting
because the market was being “stupid” was a warning, and a trap for those who
bought it.
I’ve never been fortunate
enough to be the smartest guy in the room on anything. I have known a few who
were though and not a single one of them was audacious enough to believe that
they figured something out that the smartest minds in the world, running
trillions of dollars all somehow missed. (I know, Michael Burry, “The Big
Short”. That’s a 1 in a million shot, and you aren’t Michael Burry.)
The Perma-Bull gold bugs
always think it’s a low, always think it’s a bull market and time to buy, but
that just isn’t the case. I know plenty that tried to blame the 2013-2015
decline on manipulation, refusing to believe it was a “real” bear market. It
HAD to be some evil cartel of bankers and government tamping down on gold to
keep it from going to crazy, and that is the reason for its 40% decline in 2
years. (Despite the fact that this was the fate for most commodities in the
same time frame. Copper also lost 40% from 2013 to 2015. Soybeans lost 45%.
Wheat dropped 50%. Corn lost almost 65%. Nat gas and oil both dropped 75%. I
suppose all of those moves were normal, rational, market action, while gold’s fairly
tame drop in comparison was blatant manipulation.) Since then, most accept that
this period was a bear market for gold, but I have not forgotten their pathetic
attempts to shift the blame of their bad calls onto some invisible entity, dead
set on making them look bad. But I digress…
Gold would be a buy here
IF we were in a bull market, but as Mark Twain said, “It’s not what you don’t
know that kills you, its what you know for sure that just isn’t so.” Let me
show you a few examples why. We’ll start with !GT200GDX, the index showing the
amount of GDX components that are currently above the 200 day Moving Avg.

We can see from the chart that major lows in 2018, 2019 & 2020 were all marked by the index reading at 20 or less, with 2018 and 2020 lows at 0, where we currently are now. Might seem like a no brainer, but this chart only gives data going back to 2018, during a time when gold was in a bull market. If we compared this to the 2013–2015 timeframe, I’d bet there were a lot of times we would see it at 0, and for long periods while price stubbornly kept declining.
The 200 day moving avg is
kind of a cornerstone in Technical Analysis for determining if we are in a bull
market or not. When you are, price typically stays above it, or has corrections
that bottom at or near the 200 day MA at their worst points. In bear markets,
the exact opposite. Price stays below it most of the time and rallies typically
fail near it. The very nature of a study like this one ensures that readings of
0 on an indicator like !GT200GDX will happen often and stay that way in a bear
market. Inversely, In bull markets, expect to see elevated levels for long
periods. From July 2019 to the end of the year in 2020, (with the covid crash
as the only exception) the !GT200GDX indicator stayed above 80 for 1.5 years.
I’d be willing to bet, if we had the data to go back to 2013-2015, we’d see the
exact opposite, multiple hits at 0 and staying below 20 for nearly 2 years as
gold stocks got decimated.


Above is GDX from 2009-
2012, a period when we were in a bull market, with the 200 day MA in red. Below
it is 2012-2015, a period when we were in a bear market. See what I mean? For a
VERY long period in 2013 we stayed significantly below the 200 day MA. It is
safe to assume during that period, there were 0 stocks in the GDX above their
200 day MA. That in itself was not a buy signal, as we can see price continued
to decline, and declined a lot. About another 50% from the initial July 2013
low at ~24 all the way to 12.
I’ve mentioned a few of
these points before in previous articles but they are worth repeating here
because we are at a crucial juncture in my opinion. Many are going to go out
looking at these indicators and buy, thinking they’re catching a low on the way
to new highs. In reality, I believe they are catching the “middle” of a
downwards move in a market transitioning from a bull, back to a bear, that could still have a ways to go.
In regards to Sentiment,
we can see the same looking at DSI reads on gold as well as $BPGDM, the Gold
miner’s bullish precent index. Here are charts on them. Same situation with
both. Long periods of very elevated levels during bull markets, long periods of
levels at or near 0 in bear markets. In 2013, $BPGDM spent 6 months never
getting above 10, all while price kept declining. I talked about this in my
last article in back in May. Here
is a link to it. This is an important point that’s worth
reading if you missed it.

 |
Additionally, its worth
adding in COT reports. Large spec longs in gold are at the lowest level in 3
years. The last time large spec longs in gold were at these levels it was Sept
2021 and gold was 1720, on it’s way to 2100. The time before that gold was 1680
in March 2021, on its way to 1920 in just 2 months. But if we zoom the chart
out to include the 2005- 2011 time period, in order to reference this with the
previous bull market, as well as include the 2013-2018 bear market, we saw the
same thing happen right in 2013. Gold large spec long positions hit 110k, the
lowest level since the 2008 crash down to 700 (which was 80k). They were quickly
on their way down to 28k, then to 16k in 2015, and ultimately 1k in 2018.

Ok. So, I’ve made my
point. It looks to me we are likely not at a low, but in the middle of a
continued decline in a BEAR market now. So, when do we know when we actually
ARE at a low? There is a lot of moving parts there and a lot of factors to take
into consideration as it is happening, like what other markets are doing, the
state of the economy, what the Fed is doing (or isn’t doing), as well as price
action in gold and miners that we will analyze day to day to try and determine
that when it comes. But there is one indicator that has marked every major low
in metals over the past 20 years, and given multi-bagger buy opportunities on
miners in 2001, 2008, 2016, 2018 and 2020. Ready for it?
Cost.
Basic economics. As the
saying goes, “the cure for high prices is high prices” and “the cure for low
prices is low prices.” When prices are high, everyone producing a product is
going to take advantage by making as much of it as they can to cash in. The
increase of supply, assuming demand is constant and not also increasing, brings
prices down. The same with low prices. If you can’t mine gold profitably when
the price is $1000/oz, nobody is going to. The decrease in supply ensures price
will correct back higher again.
Every screaming buy
opportunity in gold, silver and miners in the last 20 years has been marked by
the price of the metals falling to levels that were near the cost to produce
them. In 2001, Gold fell to a low of $250/oz after Gordon Brown decided to sell
Britain’s gold reserves at the absolute low of the bear market that was about
to go 8-fold higher in the next 10 years. For the year 2001, Barrick had a
“total production cost” of $247/oz. Newmont’s costs that year were similar. Two
of the largest gold producers in the world at the time were mining for break-even.
The same was true with silver. At $4/oz in 2001, Hecla’s total production cost
for silver was $3.57/oz. A mere 40c profit per ounce produced.


Could things have gone
lower? Sure. Could they have stayed low for a longer period? Of course, but for
the most part, this is unsustainable for a long period, or else there just
isn’t going to be gold and silver mined anymore. If you took that as a sign that metals prices
need to begin turning higher from here eventually, you had some great
multi-bagger opportunities in miners that gold investors love to talk about,
but most never get to see. You could have bought Barrick in 2001 as low as 13.
It went to 55 seven years later, a 4.5x return. NEM was as low as 12 and went
to 60 by 2006, a 5x return. HL could have been bought at less than $1, on it’s
way to 9 just 2 years later, and 12 if you held on till 2008. There’s the 10
bagger “white whale” gold stock investors keep looking for, and it was right
under your nose in some of the biggest NYSE listed producers. No need to search
for obscure, illiquid, unknown JR’s, hoping geology, management’s competence
and markets all line up perfectly to get you that coveted 1000% return.
Let’s move on to 2008.
Markets were crashing and no asset was immune. Gold dropped 30% from 1000/oz to
700, and silver dropped from 21 to 8. Miners got the worst of both worlds as
stocks and metals dropped, with GDX tanking from 55 to 15. According to
earnings reports on NEM and ABX at the time, gold mining costs were ranging
around 550-575/oz, giving them still a fairly decent profit margin at 700. (It’s
important to note the calculations of “costs” at the time varied, with not all
producers using the same metrics. The “All-in sustaining cost” or AISC metric
wasn’t adopted by the industry until 2013. Cash costs are just the straight cost
to produce an oz, but is not reflective of the costs to run a mining company. AISC
account for the costs associated with exploration to replace those ounces
produced as well as administrative costs, etc. Basically, all the costs of SUSTAINING
a mining company long term. I mention this because 550/oz for NEM in 2008 was
reported as cash costs, so actual costs were likely much closer to break even
at 700 gold.)
Silver though was worse.
Falling to $8/oz, it was basically at cost for most silver miners. Pan American’s
total cost on nearly 20m ozs mined in 2008 was 8.76/oz. Hecla’s total production
costs per oz were 8.52. Coeur mining’s costs were 12.50/oz. Clearly this was
unsustainable metals prices and the market was due to correct back up higher,
and indeed it did, sending miners massively higher. NEM more than tripled in 3
years, from 20 to 70. PAAS went up 4.5x from a low of 9 to 42. CDE gave you a
10 bagger, from 3.60 to 36 in the same time and HL did even better, from 1 to
11.


By 2016, metals had
collapsed from their highs and miners, (who, like the basic economics example, were
rushing to sell as much gold as they could at 1900, even if their costs of
mining were 1400.) were frantically cutting costs as their margins disappeared.
Price collapsed and costs came down. By 2014, NEM’s AISC was 1002/oz with avg
realized gold price for the year at 1250. Getting close but not there yet. By
2015, price had dropped to a low 1050/oz and NEM over that year managed to
reduce costs by only $3 to 999/oz. That’s about as razor thin as you get.
Silver at the time was $14/oz, and costs were about the same. CDE 2015 AISC was
14.62. PAAS was 14.92, and AG was 13.43.
AG rallied 9 fold in the next 9 months, from 2 to 18. CDE was 8x, 2 to 16. PAAS
4x and NEM was 3x. Higher cost miners had better returns, as most were
completely written off by investors. HMY went from 50c to $5. GSS did similar,
from 70c to 5.5.


By 2018, not much had
changed. Costs were about as low as companies could get them, holding at near
1000 an oz for gold and 14/oz for silver. Gold tanked in Aug from 1375 down to
1150. Not as razor thin as times in the past, but very close. Silver, once
again went to 14. Again, not just thin, negative in some cases. AG’s 2018 AISC
were 15/oz. HL was at 11.50 and PAAS was 11. CDE stopped reporting AISC
all-together, which should probably give some insight into where their costs
was in relation to their peers (higher). Many silver miners slipped a bit in
2019 from 2018 lows, but the multi baggers were still there even if you didn’t
catch the exact bottom. 3 years later, AG from 4 to 22, HL from 2 (to 1.50)
then to 9, PAAS from 12 (to 10) then 40, CDE from 4 (to 3) then 12.
While the 2018 to 2021
period covers the covid crash, it’s important to look at that period too. Gold
fell from 1700 to 1440. Costs were still around 1000/oz so this was still a
very good profit margin for gold producers, but just like in 2008, gold held its
profit margin and silver exceeded it, dropping to 12/oz. AISC at the time were:
PAAS= 11.40, AG=14, HL=12. (CDE in 2020 was still not reporting AISC. Interestingly,
the word “cost” appears only 4x in their 131pg annual report, and in none of
those 4 instances, do they actually give a per oz number, cash, AISC or
otherwise) If you had missed out buying in 2018, you got a 2nd
chance here with many miners dropping back to those levels or exceeding them.
PAAS and AG both retested lows from ~2018. Higher cost miners like EXK exceeded
them, dropping back to $1, its 2016 low. (After which it did a 5x, and then in
2020 did an 8x 1.5 yrs later.) HMY in 2020 fell to 1.7, near its 2018 low, then
rocketed up over 4 fold to 7. AEM met its 2018 low at 30, then tripled. All of
this in just 5 months.
Gold investors are
obsessed with the idea of 5-10 bagger returns on JRs in a bull market, and they
have a good reason to be, because as I’ve shown, its not only possible, its
happened 5 times in 20 years even with major producers. The problem is their
approach is typically to get in AFTER a massive move betting on a continued
move higher and a long 10 yr bull market. Just because we had a nice decade
long run in 1970s and 2000s doesn’t mean you are guaranteed one this time
around. It worked buying into gold after
it ran to 700 in 2006, and again at 1000 in 2008-2009. It didn’t work at 1550
in 2013 though, and clearly it hasn’t this time either.
Simple fact is, as I’ve
mentioned before, everything went faster this time around. Economy collapsed,
Fed wasted no time printing and the govt didn’t waste time spending like
drunken sailors. Gold went from “market panic crash” at 1400, to up 50% in 4 months.
Silver tripled that return, from 12 to 30, a 150% return. In 2008, the Fed kept
QE running with no consequences from inflation for the next 5 years. Within 1
year of starting up the bond buying this time, we were already at 5.4% inflation.
For all the criticisms that the Fed waited too long to act (and they did), the
time between easing and tightening didn’t give gold much to work with.
So if the way to make a killing
in gold and silver stocks is to buy when we are nearing cost, what does that
mean for right now? Well bad news. NEM and ABX costs as of last quarter are
around 1165/oz. That’s a long way from the current price of 1730. The good news
is, those costs are rising quickly, about 10% just since Q4 2021 for both
Barrick and NEM. While inflation may be peaking here due to an expected
economic decline, any positive number below 8.7% just means costs are
increasing less fast than before. I think it’s safe to assume that unlike other
recessions like 2008 and 2020, we will likely not see $20, or -$30/barrel oil
like we did then. (My guess? Somewhere in the 60s. $3/gallon or less is an improvement
from 5, but not the 1.xx range were used to in recessions). Being that oil is a
major cost for mining, this will continue to put pressure on their bottom line.
Gold is falling apart, the lows at 1680 will likely give way so where do costs and gold begin to meet? First, there is no guarantee we’re dropping to the cost of mining, but it’s happened before so it seems possible. It’s also the best time to buy miners historically. IF we see a similar situation, I believe these roads will intersect somewhere around 1400. If costs at 1165 for the major miners like NEM and ABX increase by another 10% over the next few quarters, they’re AISC will be about 1280/oz. At 1400 gold, that’s a pretty thin margin. (Of course, if costs rise more in a short period, that level might be closer to 1500. This is the part we kind of have to play by ear).
From a technical
perspective though, we can see a lot of significance with 1400. A trendline from the
lows in 2006, 2008, 2016 and 2018 line up right at 1400 currently.
Additionally, 1400 was the “ceiling” of the entire bear market. From a TA standpoint, a breakout and retest of that bear market ceiling area would not be an uncommon thing to see. It’s also the
38% Fib retracement from the 250 low in 2001 to the recent highs at 2100.

The problem is that’s
down 20% from here and knowing how silver and miners trade in relation to gold
would spell out some devastating losses. If silver dropped inline with gold (It
won’t, it’ll drop more) that would be 15/oz (13.30 if it’s a 30% drop). (As of
Q1 2022, PAAS AISC is at 13.30, AG’s shot up to 20, which will likely come back
in line ~15-16 soon. But that looks like a logical level for silver) If these
things occur, expect miners to revisit 2018 and 2020 lows. Currently a 30% drop
here in GDX sends us to 18 again. If you’ve been invested in PM miners for more
than 1 day, you know that expecting a 30% drop in miners with a 20% drop in the metal is
incredibly wishful thinking.
Right now we may be
setting up for a pause in the bleeding. The only 2 times gold has been lower
than it is now in this consolidation, were the 2 times it tested 1680. Silver
is testing the 61% Fib retracement from the 2020 low to the high at 30/oz.
Additionally, this area near 18.50 was support from 2013-2014, then resistance
from 2017-2020, so it should offer some support testing it again this time.

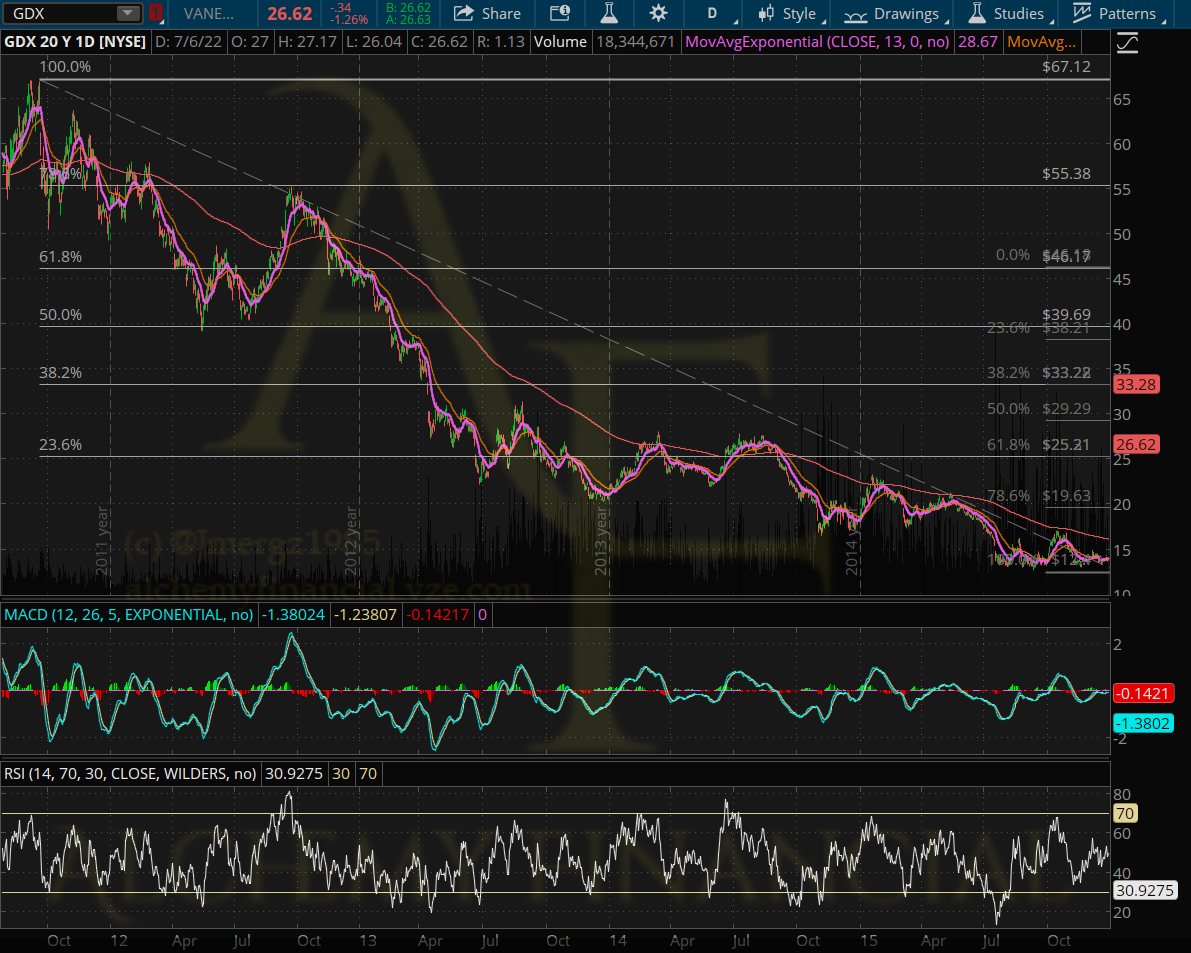
GDX is testing ~25, which
is the 23% retracement from the 2011 high to the 2015 low. This area was also
resistance from 2017-2019, then provided support in 2019. Weekly RSI is the
lowest its been since the 2018 bottom, but as we can see from that reading at
21, while we are currently at 31, we can go a lot lower. GDXJ looks similar,
just worse. After already losing 50% from Aug 2020 highs, its now testing the
78% Fib retrace from the 2020 low. This level ~30 also coincides with support,
as we can see many instances of lows and bounces from 2013-2019 near this
level.


I suppose it’s worth
mentioning the pitiful performance of SILJ, now closing in on the 23% retracement from all time high to low, again
an area it bounced at in 2013 and not too far off now from 2018 lows at 6.84.
Just another 20% down to erase all its gains for the last 4 years.

We may get a bounce here,
but I wouldn’t try to play this long. It MIGHT be worth taking some liquid, in
the money protection out by buying puts, but we’ll cross that bridge when we
get there. Don’t try to go long a bull market.
One more point I want to note. People have said how I haven’t posted as much here or on Twitter, or done very many interviews recently. Truth is, I spent all of last summer screaming the warning signs that I thought were coming in gold. I thought what we’re seeing now would begin unfolding then. I got an incredible amount of backlash and ridicule for my opinions by permabulls (who have been largely quite recently). People who scoffed at the idea that gold would be weak due to taper fears and bottom when the fed began hiking when I said it in June, finally began accepting that as the likely blueprint by Jan, which was of course, too late. Everyone shouted the same words I heard 1000x before, the most dangerous words in investing, "It'S dIfFeReNt ThIs TiMe", only to now watch miners drop almost identically to how they did in 2013.
It was tiring. It burned
me out and I kind of lost interest. Since then, been trying to focus on other
things. Gardening and hiking have been nice hobbies. With the help of a friend,
I’ve been stewing over some business ideas as well that I may wish to launch in
the future. For now, the trend is down so if there’s nothing to do in your
portfolio, do something else, and I have been.
If there’s something
important to say, I’ll be there to say it. As I did in Jan right before gold
turned higher. As I did in March when DSI numbers were signaling a top. When I
think we reach that multi-bagger, near cost, buying opportunity in gold, believe
me, I’ll be on Twitter and on here saying it. My goal has always been to help
the smaller PM investors navigate a volatile market, while trying to cut through
the Perma-bull crap and conspiracy theories to get to the stuff that actually
matters, like how to ACTUALLY make 1000% in miners by buying when price is near
cost, not because Basel 3 is a game changer that will send gold to 10k by next week.
I’m not going anywhere. I’ll be there screaming when the time is right.
(Perhaps it can be done on an better platform in the future?)
Remember, leverage kills.
You won’t go broke picking a few bad stocks. You go broke picking 1 bad stock
with leverage. If you have leverage, get out. Live, learn, move on. This is a
bear market and your only goal here is to survive it.
-Jonathan Mergott
