It
should be apparent over the last few years why this is a curse, not a blessing.
Alas, things continue to get more interesting. In addition to a pandemic, a
resulting economic collapse, high inflation (a result of their “solution” to
the economic collapse), we can now tack on War in Europe, a declining economy,
an inverted yield curve predicting yet another recession, and skyrocketing
interest rates (the solution to the inflation that was the solution to the
collapse that is most likely going to be a major catalyst in the next
collapse). Lather, rinse, repeat.
There
is so much going on regarding the economy that I could probably go on endlessly
on various different things, but I won’t bore you with all that. (That I save
for my friends and girlfriend. And sometimes the cat when they all stop caring).
As I’ve said before, I prefer to watch price action in the market as the
biggest “clue” in what is being thought and focused on, rather than focusing on
the macro and developing a thesis for how the market will trade based on that.
In
my view, the problem with that mentality is two-fold. First, your analysis of
the data and what the data will be, may be wrong, and second, even if you're right about the data, your interpretation of how the market will trade off of
that data could be very far off. If you’ve
been “watching and learning” over the last few months/years, you can probably
think of at least a couple “marco” focused guys who’ve had rigid
interpretations of how the market should be trading, that have been terribly
wrong. As Mark Twain said, “It’s not what you don’t know that kills you, it’s
what you know for sure that just ain’t so.”
Let’s
dive into gold, silver and miners.
I’ve
shared the gold “cup and handle” chart a few times before, and from the big
picture aspect of this chart formation, there is nothing unusual here even
after this sell off. In fact, I think we could stand to see further declines
without doing too much longer-term technical damage. There is an 18-month
downtrend line of declining highs we broke strongly above back in February.
Currently, its sitting nicely aligned with the 61% Fibonacci retracement from
the 1680 lows in March and August, to our recent highs at 2100, right at about 1830.

This area at 1830 also makes up the “ceiling” that gold had from June to
when we broke above in February. (With an exception in Nov when we pushed above
by about $50 to 1880. That rally proved to be short lived, but we were able to nail the
turning point in early Oct beforehand and made a pretty nice profit on it.) It would
be perfectly normal from a technical analysis standpoint, if gold were to
retest that broken trendline level, so we still have a good amount of room
here before needing to worry. That
being said, we are VERY oversold short term right now. RSI on 4 hr gold hit 19
this morning, the lowest level since mid-November. (After that decline, gold slouched
for about a month, then began drifting higher. 2 months later, it ripped up
17%, or $300 to retest all-time highs in just 5 weeks. A similar situation now still leaves us setup
well for a summer rally and Aug peak. A 17% gain from 2100 is 2450, pretty
close to the projected target of this cup and handle).
This
decline has been very harsh and very fast and its likely time for a pause here.
Gold is sitting at support near 1890-1900 that it’s tested and held at twice
before. Daily RSI is right at 40, a level that has held on every pullback since
December, and is a level we typically see readings above during upwards
trending markets, which I’ve talked about before. (Inversely, downwards
trending markets often see highs on RSI around 60.) In hindsight, we can see
that a little over a week ago, when gold tested the 2000 level, RSI peaked and
reversed at exactly 60 as price reversed and also closed below that 23% Fib
level. That may have been a warning sign a correction was forthcoming.
If
you’ve been focusing on Silver, you might be a bit more pessimistic. While it’s
important to take into account how silver is acting, GOLD is always the one in
the driver’s seat for the metals that should be given more attention. And if
you’ve followed me for any period of time, you’ve probably heard me say “watch
the miners”, as I give a higher weighting to their performance than either silver
or gold, and here’s a perfect example why:
I
had called for a low March 2, 2021. A major factor in that call was a reversal higher
in GDX (the same thing that occurred on the low on Nov 30th 2020,
which we also nailed for a nice $200 rally). Gold kept slumping for a few more
days after that and GDX marked a few cents lower the next day then began moving
higher. By the end of March, Gold had retested that low at 1680, double
bottoming. Silver though, as highlighted by those 2 circles, made a lower low
later in March. One looked like it could be bullish, the other looked certainly
bearish. The tie breaker, and the one that gave you the best hint of what was
to come next was the GDX, which bottomed 4% higher than it’s low earlier that
month.

Once
again, we have a similar setup. Gold has tested these lows near 1900 a few
times now and held, while we see silver making a lower low. I think much like 1
year ago, silver is painting a more bearish picture that may not necessarily be
true. On the upside, we stopped and reversed from the lows early in the day
today on silver and then gold and miners followed, so we may indeed be seeing a
bit of a pause here in these declines. There is very strong support below these
levels, here at 23.50 as well as 23, 22 and the final lows at 21.50 hit last fall
and winter. Granted, on the lowest side of that range around 21.50, that is
still down almost 8% from where we are now, but we’ve already dropped 12% in
about 1 week. Precious metals are
volatile assets. Best get used to that kind of volatility sooner rather than
later.
Another
point on silver, we reversed and headed lower right at resistance at the 23%
retracement from the 2016 lows to the 2020 highs. RSI also stopped and reversed
lower at 60, the same as it did in gold. This again, was a SMALL warning, but it
was a warning. Reversals like these are usually not a bad sign to maybe bail on
the last of the “dip” buys you made on the way up. Perhaps overly cautious, but
when you’re dealing with assets that can drop 10-15% in a week, it’s not a bad idea
to be a little extra cautious with additional money you put in to “trade” or
dip buy to leverage profits on the way up.
Moving
on to miners, GDX has had a horrid few days here, declining 16% in 1 week. But
we are now approaching an area of support in the 33-35 level that was the
ceiling for GDX all through the summer and into the winter. Just like Gold and
Silver, GDX is also very oversold in the short term. Additionally, we had a pretty
significant bounce off of today’s lows. At the worst point, GDX was down about
5.5% and bounced 2% off that level. In comparison, gold bounced $8 from its
lows and silver bounced 20c, or about 1%. So this relative outperformance at
the end of the day for miners when at major support may be solidifying that idea
that we’re making at least a short term bottom here.

Not to digress too much but I want to make a point here. I've said "watch the miners" so many times they should put it on my gravestone. But if you've been employing that mentality over the course of the last year, I hope you understand now why I say that. We saw gold peak on March 8th at 2100. GDX hit 40 then reversed hard, down about 10%. As gold consolidated at a level almost $200 from the high, GDX continued higher. Countless down days in gold the last couple of months saw GDX open down 1-2% then end the day green again. Miners shrugged off all weakness in gold and kept chugging along.
This is the EXACT opposite of how they acted all through the summer till about Jan this year. Every time gold was up, miners didn't care and kept heading lower. Consequently, that entire time period when they were acting this way was not a great time to be holding them. When I turned bearish in June last year, this was a major reason why. A lot of people dismissed the relative weakness as manipulation, or the market being "stupid", saying my claim that miners lead metals was completely untrue.
The fact is, we've called several major lows in gold and miners over the last couple of years, most of which were to the day or within a day or 2 of the lows and all of those were preceded by miners reversing losses and exhibiting relative strength to the metals. Inversely, I was one of few bears in June citing this as a reason for concern and repeatedly had my analysis dismissed. For the next 8 months, PMs and miners proved to be a terrible asset to be holding.
Miners leading metals isn't always the case. As many have been quick to point out, 2 or 3 major lows over the last decade or longer this was not the case for. The last article I wrote, "Bull State of Mind" I pointed this out. In 2016, there was no warning at the lows, gold and miners just took off like a rocket, and I warned we will likely see similar when gold finally bottoms this time, but I believed after an 18 month consolidation, if gold was going to break down, it would have done so by now. This was a major reason why I turned bullish again. Another major reason was hearing many of the people who criticized my analysis in June, that there is risk in PMs until the fed begins hiking rates, begin to finally throw in the towel and accept that that was likely going to be the case.
I'm an introvert. When the room gets too crowded, I start worrying. I'm glad so many finally figured it out, but it was 6 months too late and it was time to be planning for the bottom, not planning for risk. I said this bottom will likely give no hints when it arrives and will be difficult to catch by the methods I typically use and that was exactly the case. The rally ripped out of nowhere catching many off guard. Despite getting no clear "signals" that I usually go off of, it's worth mentioning we still caught that low nearly perfectly. After 8 months of being bearish, I turned bullish again and posted that article on Jan 27th citing my reasons why. On Jan 28th GDX retested lows at 28.67, then turned and took off, gaining 45% in 2.5 months. The point is, more often than not, watching the miners gave you the best clues for turning points in the metals, and whether or not it was safe to come out and play. For 8 months since June, it was not. The last few months have been very noticeably different.
After
any type of move, be it long term or shorter term, I pay a lot of attention to
the counter trend reaction. Looking longer term, GDX is now testing the 50%
retracement of the entire move up from the lows around 29 in late Jan, to the high just 1 week
ago at 41. Two steps forward and one step back is completely normal, healthy
price action here, (even though it took us 2 and a half months to take the 2 steps
forward, and 1 week to take the 1 step back). We have some elasticity here for further
declines just like gold and silver, but I think we should start firming up here
now.
In
the shorter-term aspect of looking at the “corrective” move, we just suffered a
fast 6-point drop. One step back would be a 3-point rally. If price were to
rally to near 38 and begin to falter, that may be a cause for concern, signaling
further declines but we need more time to analyze how we are reacting here.
Worth noting, 38 is right where the moving avgs currently sit, that are both
turning down sharply and about to give a bearish cross lower. A rally up to near
that level that can not hold for a long enough time to turn them higher and give
us a bullish signal would also back the theory that a concern about further
declines is warranted.
I
want now to talk about what my concerns here are, and even though I am still
bullish, there are a few of them. The first is a bit unusual and is highlighted by the purple lines in the GDX chart. Today’s gap down was
at the EXACT same level as the gap lower after the June FOMC. For those that
remember, it was the pitiful performance of miners relative to metals and the Fed
hinting at a tightening cycle beginning soon that was the reason I turned
bearish on PMs and miners after that happened. (And it was the right call. GDX dropped
20% from there and did basically nothing for the next 8 months) The similarities
in this drop and that gap are a bit too much to ignore.
The reason we pay
attention to charts is because a chart is simply a visualization of price
action. Price action is the result of the human emotions of fear and greed that
drive buying and selling. These emotions and behaviors have never changed throughout
history, which is why we can look at charts of tulip bulbs from the 1600s,
railroads from the 1800s and tech stocks from the 2000s and see the exact same
pattern play out over the course of those 400 years.
That
being said, there is no “fear of taper” anymore or anything else regarding this
tightening cycle. Fed is talking about 50bp hikes now and the 10 yr is an inch
away from 3%, the highest level in almost 4 yrs. (Since fall 2018, as gold was
making its final bottom and the fed was making it’s final rate hike. They
started cutting a few months later). The Fed can go ahead and hike, it doesn’t
matter, the market has made the hikes for them already. If there’s an
underlying fear in gold right now, I don’t think further tightening by the Fed is
the reason.
I
don’t particularly see a reason right now for extreme fear in gold, so I do not
think this is a similar situation to June. I of course, could be wrong. In a
few months, we could be looking back and see the reason quite clearly, as is
the case with the majority of investors in the market. By the time you catch
on, everyone knows, and you’ve missed the chance to act. A major difference I’m
seeing between now and June is this: In June, gold was getting killed and
miners were getting killed even deader. Right now, miners are getting killed (AFTER a 45% run higher in GDX) but gold’s action is not at all bad, in my opinion.
Additionally,
it’s not just a factor of price action, but of price action over a period of
time. Last summer, as gold and miners got killed, the was no relief bounces.
Every very oversold time when it was logical that we SHOULD see a bit of a
bounce, we didn’t. This went on for WAY longer than is healthy in a market that
should have been trending higher. Multiple times we saw gold up $20 only to see
GDX open up a dismal 1%, then lose it all and close down 2.5%, despite metals
holding their gains. It’s possible we can get that, it’s only been 1 week so we
need to give this time to see if price action repeats as it did then, and
caution may be warranted. Or, if things begin to firm up here, as I think they
should.
Moving
back to the gold chart I do see another concern. Again, we pay attention to similarities
in patterns because they are depictions of human behavior that have a tendency
to repeat again and again. What concerns me here is the striking similarities
in the 2 runs up to 2100 in Aug 2020 and just recently, highlighted in the
black boxes. Not only is the price
action identical in both instances, but price itself is as well. Both these tight
consolidation patterns happened after a straight up move to 2100 and are
consolidating at the exact same levels. The concern is what happened next, a
dive down to 1760, rally of $200 then a decline of $300 to 1680 over a period
of 6 months. Obviously, we will have some waiting to do before new highs if
this plays out the same and begins breaking down much more from here, and I don’t
think that’s what any of us want (unless you’ve been severely underinvested).

There
are differences though. In Aug 2020, gold was hitting a new all time high up
50% from where it was just 6 months earlier. Today, after a tiring, 20% down 18-month
correction, we have retested those highs beginning from a higher starting point
over a shorter period of time. This reminds me more of the final few months as
gold tested 1000 in 2009, before breaking out and doubling over the next 2.5
years.
In
Feb last year, weekly moving avgs gave a sell signal on gold that was followed by
a steep decline to 1680. MACD crossed
below the 0 line and RSI broke below 40, both are levels we want to see hold on
a weekly chart if there is to be a long-continued bull move higher. (2009 to 2011,
weekly gold RSI stayed above 50 and MACD decently above the 0 line on every
correction for over 2 years.) After that correction, gold moved strongly higher
and every correction after saw RSI hold above 40 while MACD stayed neutral,
completely flat at the 0 line. Weekly moving avgs gave a bullish cross higher
in Feb and soon after we’re retesting all-time highs.

2009
was nearly identical action. A moving avg bearish cross in Aug 2008 saw gold
decline sharply to 700, the 2006 highs. RSI broke below 40 and MACD crossed
below the 0 line. A few months later, gold had rallied, MACD crossed back above
the 0 line and stayed above it while RSI stayed above 40 as well. Moving avgs
gave a bullish cross higher and soon after we were testing the all time highs
at 1000/oz. We took a few more months to breakout entirely, but we got there.
After that, RSI never went below 50 on any correction. MACD stayed above 0 line
as well. Corrections in gold came down to the 30 week moving avg then resumed
moving higher while the moving avgs themselves also trended higher and did not
give another bearish cross “sell signal” for 3 years, all while gold doubled in price.

These
were the key signs to be long and stay long for the long term, and I think we
will see something similar again. Moving avgs have crossed higher and weekly
gold is now testing right in that area. MACD is comfortably above the 0 line
and can still afford some cooling off here. RSI has held above 40 since last
June and is currently 52, so it can also cool off a bit still. Longer term,
things look good, and I have no reason to believe this is anything but just a
correction for now, but we do need some more time to hash things out and make
sure this doesn’t continue to bleed and repeat price action like we saw over
the summer. The extreme drop in miners, is still a little concerning.
Another concern here is something in technical analysis people like to call the "false break before the real move", and it's exactly that. It's when a market is consolidating and breaks lower or higher initially, only to reverse that move and break in the opposite direction for a longer term, trending move. If that is the case here for gold, then this false break moved up 25% from our lows at 1680, and that has to be one for the record books in terms of a "false" break. While it is certainly possible with this ever increasing volatility, I think it's unlikely and refer back to the 2009 analogy, that this is likely a retest of highs and final coiling that will eventually breakout and give us a long term trending move to new all time highs.
There
is one more obvious risk to address here and it’s the “Master Key” in terms of
market risks across all asset classes, and that is a recession. Gold likes to
run up ahead of recessions, as it did from 700/oz to 1000/oz leading into the
financial crisis, and as it did from 1150/oz to 1700/oz as it did leading into
Covid and the 2020 market crash. 1 month ago, the 10 and 2 yr yield curve
inverted. In 50 yrs, there has never been a time this hasn’t resulted in a
recession and there has been no recessions since then where the yield curve
inversion didn’t proceed them. So, it’s been 100% accurate with 0 false signals.
That’s a far better record than any economist or analyst I’ve ever seen. I’m
siding with the yield curve that a recession is coming and is likely the
culprit of “higher costs” through both inflation and rising rates. It seems
very likely at this juncture that the Fed has made a critical error in not tightening fast enough and will now push rates to a breaking point in the face of a struggling economy.
On
average, a recession typically follows around 12 months after an inversion. In 2008,
the yield curve inverted 16 months before the recession. In 2020, it was only 9
months. 12 is the average, but in this overleveraged, highly indebted, increasingly
volatile world we live in, there is no reason it can’t happen much sooner. The
market has resumed tanking and has lost over 7% in just 3 days, approaching back to the lows of this corrective move, and doing so alarmingly fast. My thinking was that
gold will have time to run leading into a recession within 12 months, and there
will be an opportunity for profit taking and cash raising on gold positions BEFORE
a market crash, which in both 2008 and 2020 led to a slew of margin calls that
took everything down with it, including gold. But we very well can be a lot
closer to a recession and a major crash than I think. 12 months is just the
average. There’s no reason it can’t be 4 months, or 6 months. (And make no
mistake, leverage and volatility have done nothing but increase. This affects
all asset classes. In a massive crash, everything gets sold. To most investors,
gold is simply a hedge, not a position. Apple is their position and when Apple
is down 30% and their “hedge” is up 20%, which do you think they’re going to
sell?)
Now
keep a few things in mind. If a recession and crash is closer than we think,
this doesn’t mean cash out on your retirement account. When the yield curve inverted
in May 2019, the market went up 20% after that. When the crash came, it was
down 20% from that level when the inversion happened… for about 2 weeks. If you
nailed buying EVERYTHING back at the low, you got a nice discount. But most didn’t
and missed a 100% rally in the SPX over the next 2 yrs. In reality, most looked
at 50% declines in the SPX in 2009 and 2001 and assumed similar, so when the
SPX was down 25% in March 2020 they sold expecting another 25% down and that of
course, was the bottom.
With
that being said, it was a great time to have SOME cash. I bought HL for $1.60
in March 2020 and that is the type of opportunity that is terrible to miss, so
if you have not reached the point in your investing career where you have
realized having at least a small cash position available at all times is wise,
you might want to think about that. If a recession is on our horizon, we know
how they will “fix” it. We’ve seen this movie before. 0% interest rates, quantitative
easing (ever expanding, likely to include outright stock purchases next time
around) and govt spending. And the beneficiaries of these policies will be gold
and stocks, so having some cash to buy at panic prices would be ideal.
One
final note regarding Jr miners. Many have been frustrated regarding small Jrs
not really moving on this last rally in gold. As a few have correctly pointed
out, investing in Jrs is investing in what typically is the most profitable,
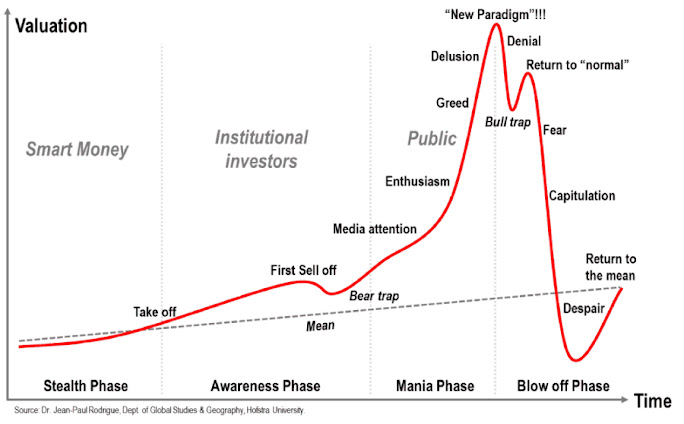
but final stage of a gold bull market. Chances are you’ve seen the “bubble
model” chart below and while it is meant to represent a bubble, in reality it’s
a fair representation of any bull market, as by nature the final stage and
highs of a bull market will be typically bid up in speculative euphoria to levels
far beyond any realistic valuation. We just suffered a long, painful 18 month
correction in gold, and in that time nearly everyone proclaimed, “gold is dead”
and that it’s “on it’s way out as an asset class”. This quick spike back to all
time highs has not convinced any of them that they were wrong. If anything,
they’re likely shrugging it off as a double top, panic reaction to Ukraine invasion,
etc. We are far from the speculative euphoria that comes from a rush of money
flowing into small gold and silver stocks.
Let’s
look at the bull market cycle of tech stocks for example. Around 2010, smart big
money institutions were buying stocks like Apple. While that move seems obvious
now, back then we had the European debt crisis and there were many concerns of
a double dip recession. Tech wasn’t as clear a buy then as it may seem now. In
2010, AAPL was about $8-10 (adjusted for split). Over the next 5 yrs it went to 32 and by 2015, it
was all CNBC could talk about, and every retail investor in the world was in it
drooling all over every earnings report. By that time, the smart, big money had
made their profit and were looking for what’s next. Who is going to grow into
the NEXT Apple?
In
2014 when it debuted, no one was talking about ARKK. A fund consisting
of “innovative” small tech companies, most of which with little assets and
revenues, and almost all of it with no earnings whatsoever. While the whole
world is laughing at Cathie Wood right now, after ARKK has lost 66% from its
highs, that ETF went from $15 in 2015 to $150 in early 2021. A 10-fold return
in about 5 years.
Now, we have likely seen the peak in tech, so we have an
entire picture of beginning to end to analyze here in this bull market cycle.
What started with big institutional money buying large tech companies, ended
with retail investors yoloing call options on unprofitable small tech companies
based solely on hope. The themes of the last few years have been retail
investors pumping up things like ARKK, TSLA and GME. I personally can’t think
of a better depiction of the end (perhaps an exaggeration though) of a bull market cycle than that.
The
moral of this story is, as a Jr mining investor, you’re buying ARKK in 2015. A
basket of companies with no earnings and little in assets all hoping to be the
next Apple. Some will have fantastic gains, some will do ok, some will go
under. Jr mining is the same. They all are money pits throwing cash into the ground
in the hope of increasing their assets. Some will succeed in increasing their
values and do fantastically well and become the next Newmont. Some will do ok, some
will go under. (And ultimately, like all bull markets, many that don’t do a good
job increasing the value of their assets will still do ok, as market
speculation will send them way higher than is justified by logical valuations, same as with ARKK).
There’s
reason why NEM hit new all-time highs and most Jrs haven’t budged, outside of
individual good news stories that have driven a few higher. NEM is the largest gold miner in the world. They
have the best assets and the best management. It’s got a 57 billion market cap,
they pay a 3% dividend, and they’re the only gold miner on the S&P 500 (and
many big funds are limited by market cap size, credit rating etc in stocks they
can buy, making NEM one of the few they can invest in). In other words, to the
smart big money buying into the beginning stage of a bull market, they’re
Apple. When the big money has made their profits and retail is foaming at the
mouth over NEM’s gains, you are already positioned in what they are going to
look towards next in the euphoric speculative end phase of the bull market,
that is usually the most profitable.
To
sum everything up, we do need a little time to see how things play out. Violent price
swings one way or another don’t mean much if they can’t hold over a significant
period of time. But I do think we are due to find some support here and pause a
bit. More correction can certainly come, but until I see any significant reason
otherwise, I am remaining bullish longer term with the obvious caution that a
recession can be headed to us sooner than we think.
I’ve said it before and I’ll
repeat it, volatility will only increase over time so be VERY careful using
leverage, and ideally stay away from it all together with the headwinds we have
right now. Make a plan to build some cash if you don’t have some, but don’t
panic sell your retirement account. Most importantly, do what you must to
ensure your portfolio SURVIVES until payday comes.
-Jonathan Mergott